
Stillness, Second Thoughts, and Stagnation. Also Known As: The September Jobs Report

Updated: Oct 13
There is a sentence in this morning’s jobs report that I have not seen BLS write before:
“Employment in all major industries changed little over the month.”
Not one sector moved enough to mention. Payrolls added 29,000, unemployment ticked up to 4.2%. Wages crawled up five cents. September, as an economic event, didn’t even happen.
What did happen is that the past changed. Yet again.
Three Versions of July
July 2026 has now been reported to the public three separate times, with three different answers:
Released | July 2026 payrolls |
August 7 | -23,000 |
September 4 | +21,000 |
October 2 | -10,000 |
A loss. Then a gain. Then a loss again. Same month, same agency, same methodology; three numbers, each of which was the official figure at the time somebody wrote a headline about it.
August came down too, from the celebrated +162,000 to +133,000. Between the two, this morning’s release removed 60,000 jobs from the record.
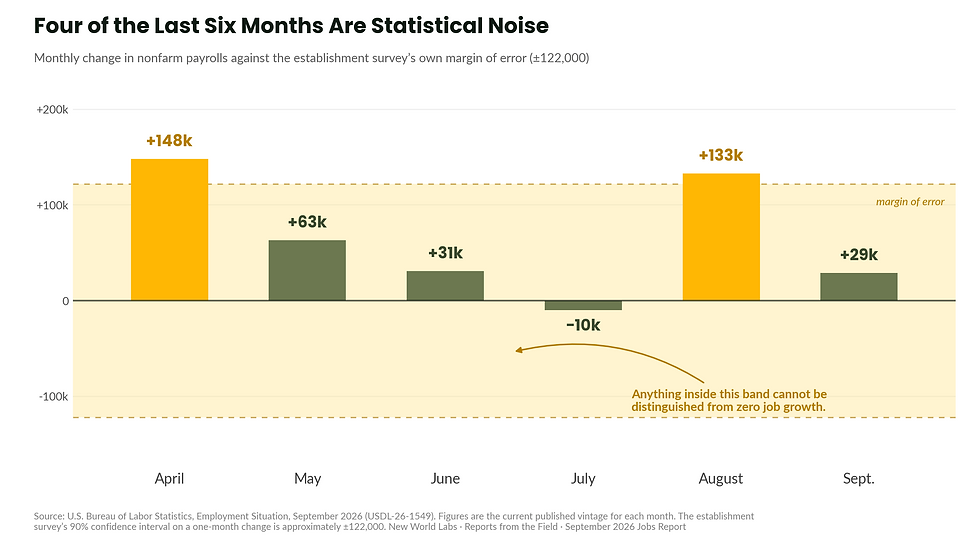
Here is where the last six months actually stand, as of today:
Month | Current figure |
April | +148,000 |
May | +63,000 |
June | +31,000 |
July | -10,000 |
August | +133,000 |
September | +29,000 |
Six months. An average of 66,000 a month. And with the establishment survey’s margin of error at ±122,000, only two of those six months (April and August) can be statistically distinguished from zero.
I’ve written some version of this every month since February. I’m going to stop calling it a caveat: a first print is decidedly not a fact anymore, it’s just a draft.

The Watch List
I’ve been telling you each month which numbers to keep an eye on. Two of the moved this month, and they moved in a direction nobody expected, so let’s go to the scoreboard.
Participation recovered. The rate hit 61.8% in September—a third consecutive monthly increase, up from 61.4% in July. And BLS, which in the July release wrote that participation was “down 0.7 percentage point since January,” now writes that participation and the employment-population ratio “showed little net change since January.”
That is a real improvement and it deserves to be said plainly. Over three months, the aggregate participation decline I’ve spent the year documenting has largely closed.
What hasn’t closed is the year-over-year picture: the labor force is still down 999,000 from September 2025 even as the population grew by more than a million, and there are 2.33 million more Americans outside the labor force than there were a year ago. The exodus has happened. The last three months have been a partial return, and it’s worth watching whether the return continues or stalls.
The 45-to-54 streak broke. That cohort added 238,000 jobs in September, its first increase in six months. It’s still down 817,000 over the year, and the level only climbed back to roughly where it say in July, so this is a bounce off a bad August, not necessarily a recovery. But I said to watch whether the streak would break. It broke.
The pattern that actually matters here. In July, the 25-to-34 drop I’d flagged in June reversed. In August, the full-time to part-time gap I’d measured narrowed by more than a million in a single month. Now the 45-to-54 streak.
Three things I pointed at, all of which moved hard within a month or two of my pointing at them. Add the benchmark finding that private employment was overstated by 178,000, and a July figure that has been published three different ways.
That’s moved out of a story about one person’s analysis, and into a story about the instrument itself.
So this is the rule I’m operating under going forward, and I’d suggest it for anyone reading these reports: no single month of this data describes the economy. One month is one noise reading from a survey under strain. The only things worth building an argument on are the ones that persist across many months.
And three of those persisted in September.
Nobody Is Quitting Again
Job leavers (people who quit voluntarily, betting a better job exists) fell to 741,000 in September, down 173,000 in a single month. That is the lowest figure of 2026, and at 10.4% of all unemployed people, the lowest share of the year.
In August that number jumped to 914,000 and I called it one of the genuinely encouraging signals in the report. One month later it is not just back, it’s below where it started.
Because the fact of the matter stands: you don’t walk away from a paycheck unless you believe another one is available. In September, fewer Americans believed that than in any month this year.
Nearly Nine Million People Are Working More Than One Job
Multiple jobholders reached 8.99 million in September—5.5% of everyone employed. That is the highest share in the series, up 181,000 in a month and up 629,000 since March.
Six consecutive months of increase. No reversals, no whipsaw. This is the one thread in my coverage that has done nothing but go int eh same direction all year, and the one most journalists and economists seem to be ignoring in their reporting.
Alongside it: 44.1% of all unemployed Americans have now been out of work for 15 weeks or longer, the highest of the year, rising every month since June. Long-term unemployment, at 27 weeks or more, sits at 1.94 million, 27.1% of the unemployed.
The people along the margins keep accumulating. That finding has unfortunately survived every revision, every reversal, and every good month.
Black Unemployment Jumped a Full Point
The single largest demographic move in this report, and BLS flagged it in their own summary: the unemployment rate for Black Americans rose from 6.0% to 7.0% in September.
For comparison, the same month: White 3.6%. Asian 2.9%. Hispanic 4.7%.
A rate of 7.0% is nearly double the White rate. In a month where BLS says no major industry moved and the overall rate ticked up a tenth, one group absorbed a full percentage point.
This is the kind of number that gets a single clause in most coverage. It deserves more, so I’ll be tracking this moving forward.
The Quiet Places
A few things moving slowly enough that nobody is noticing:
Financial activities is down 129,000 since its May 2025 peak, and BLS tells us insurance carriers account for 90,000 of that. One sub-industry, two-thirds of the decline.
Health care added 17,000 against a 12-month average of 33,000. That’s the fourth consecutive month below trend. And inside it: ambulatory services up 13,000, hospitals up 12,000, while nursing and residential care facilities lost 9,000. The care economy is growing at the clinic level and shrinking at the nursing home.
Wages rose 3.0% over the year. That is the fourth straight month of deceleration: 3.5%, 3.2%, 3.1%, 3.0%.
What I’m Watching
The final benchmark revision arrives in February 2027 and will re-anchor every number above to tax records. Between now and then, I’m watching three things: whether multiple jobholding clears 9 million, whether the 15 weeks and over share keeps climbing past 44%, and whether Black unemployment holds at 7%.
September was a month in which, by the Bureau’s own description, nothing happened in any major industry. The unemployment rate has now say between 4.1% and 4.3% for seven straight months.
That stability is being read broadly as strength; I’d read it differently. A labor market where nothing moves is not a labor market at rest. It’s one where the doors have completely stopped opening: where 741,000 people were confident enough to quit, the fewest all year, and 8.99 million are working more than one job, the most all year, and 44% of the unemployed have been waiting longer than three months.
Nothing happened in September. That’s the problem.
Key Data At-A-Glance
Indicator | Sept 2026 | Sept 2025 | Direction |
Nonfarm payrolls (monthly) | +29k | — | ↑↑ |
Unemployment rate (U-3) | 4.2% | 4.4% | ↓ |
6-month average (Apr-Sep) | +66k/mo | — | ↓ |
Unemployment rate (U-6) | 7.6% | — | ↓ |
Labor force participation | 61.8% | 62.5% | ↓YoY, ↑3 mo. |
Labor force (YoY change) | -999k | — | ↓↓ |
Not in labor force | 105.3M | 103.0M | ↑↑ |
Long-term unemployed (27+ wks) | 1.94M/27.1% | 1.82M | ↑ |
Unemployed 15+ weeks (share) | 44.1% | — | ↑↑ |
Job leavers (voluntary quits) | 741k | 860k | ↓↓ |
Multiple jobholders | 8.99M/5.5% | 8.81M/5.4% | ↑↑ |
Employed, ages 45-54 | 31.67M | 32.48M | ↓↓ |
Marginally attached | 1.47M | 1.74M | ↓↓ |
Black unemployment rate | 7.0% | 7.6% | ↑ 1.0pp m/m |
Avg hourly earnings (all private) | $37.81 | — | +3.0% YoY |
Prior-month revisions | Jul -31k, Aug -29k | — | ↓↓ |
Sources: BLS Employment Situation, September 2026 (USDL-26-1549), released October 2, 2026; Summary Table A, Tables A-9, A-12, B-3. Prior vintages from USDL-26-1435 (August), USDL-26-1291 (July). Benchmark figure: CES Preliminary Benchmark, USDL-26-1425.
Jillian O’Malior is Founder & Principal Strategist at New World Labs, building people-first brands and cultures in the Age of Intelligence. Fifteen years in employer brand across in-house, agency and consulting. Work with New World Labs · Follow on LinkedIn • Follow on TikTok



Comments